2016 was an incredible year for real estate sales in the Bulls Bay area with activity surpassing pre-recession rates. MCVL Realty led all other offices in the area in sales for the 3rd year in a row and more than doubled last years sales with 53 sides totaling over $7.5 million in sales. These sales represented a 24% share of the McClellanville / Awendaw market, twice that of the closest competitor. A majority of these sales came from within McClel- lanville, where we dominated the market with a commanding 36.7% share. This chart shows the number of sold properties each year bro- ken down by location. While cumulative sales in the area rose from the year before, you can see a slight dip in Awendaw’s sales, though McClellanville’s sales more than made up the difference and showed a 60% increase in sales over the previous year. Awendaw’s decline was due not to a lack of interest, because that market grows hotter by the day, but was brought on only by a lack of inventory.
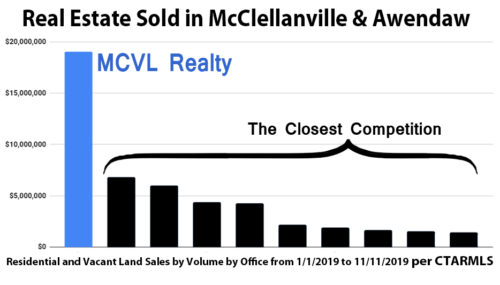
The next chart shows how the inventory of properties for sale has changed during this same period of time. You can see before the recession, inventory was below 40 properties (that’s homes and land) in each area, but as sales slowed there was a tremendous backlog of properties sitting and sitting on the market. We are still selling off much of this inventory and as prices regain footing, peo-ple are now listing new properties for sale as well. The number of properties for sale in McClellanville has generally hovered between 100 and 125 for the last 5 years with about 80% of that inventory being land for sale. Awendaw, on the other hand, has declined from its high of 128 listings for sale to a recent low of 55, of which land also represented about 80%. This difference between these two markets has led us to see the price of property climb more rapidly in Awendaw than in McClellanville. The law of supply and demand dictates whether we refer to a market as a “buyer’s market” or a “seller’s market” and I would say that for the time being we are still in a “buyer’s market” in McClellanville and Awendaw is fairly bal- anced but leaning toward a seller’s market especially with homes where there were only 11 houses for sale at the time of publication, one below $200K and 2 more in the $200-$300K range.


The final chart shows the breakdown of sales by property type with residential sales remaining fairly level over the last 3 years, but the area picking up an extra 21 land sales from 2016 over 2015.
So far in 2017 11 lots and 7 homes have sold and 28 properties (14 homes and 14 lots) are under contract. January set an all time record in the area with 10 sold properties. Looking forward to the rest of the year, everything points toward a continued rally in the market which will only be limited by the supply of great proper- ties, so give us a call today to discuss listing your property! Or if you are a buyer, let the local experts help you navigate these tricky waters and still find you an outstanding deal.